Duration: Oct 2023 - Dec 2023
Tools: Google Analytics 4, Google Workspace, Google Looker Studio
Team: Leewon Seo, Evelyn Mukerjee, Dominique Dorvil, Ava Deng
Team: Leewon Seo, Evelyn Mukerjee, Dominique Dorvil, Ava Deng
My Role:
- Uncovered insights from Google Analytics 4
- Formulated observations and recommendations for the news section
- Constructed a Google Looker Studio Dashboard for future client use
- Designed and structured the Evaluation Report and Presentation Deck
How well does Pratt Institute's new website cater to its site visitors?
Pratt Institute has recently relaunched their website in an effort to spruce up its style and keep up with new digital trends as a design school. Pratt’s developers have turned to the digital analytics class to analyze the site using Google Analytics 4. They have asked to pay special attention to four pages, including Pratt News, Pratt Events, the Daily Hub, and Prattfolio. Each of these pages discuss happenings at Pratt within the community and alumni community, and work to highlight different aspects of Pratt’s community engagement.
🔎 This is what we aimed to know..
1. How are users interacting with Pratt’s events, news, prattfolio, and daily hub pages?
2. Demographic wise, who is visiting these pages the most?
3. Are the selected pages driving traffic to Pratt Program information pages?
4. Are the pages successful in gaining interest/applicant leads in Pratt programs?

We assessed the performance of the Pratt Website by Google Analytics 4.
Date: We analyzed Google Analytics data for Pratt Institute spanning from January 1st, 2023, to October 1st, 2023, to uncover insights into user interactions with the website. For specific explorations, we focused on October 1st, 2023 to October 31st, 2023 to compare with other months.
Primary metrics we analyzed include:
- Sessions: Avg. Session Duration, Pages / Session, and Number of Sessions
- Users: New and Returning Users and Device Category
- Behavior: Bounce Rate, Source / Medium, Avg. Time on Page, and Page Path Analysis
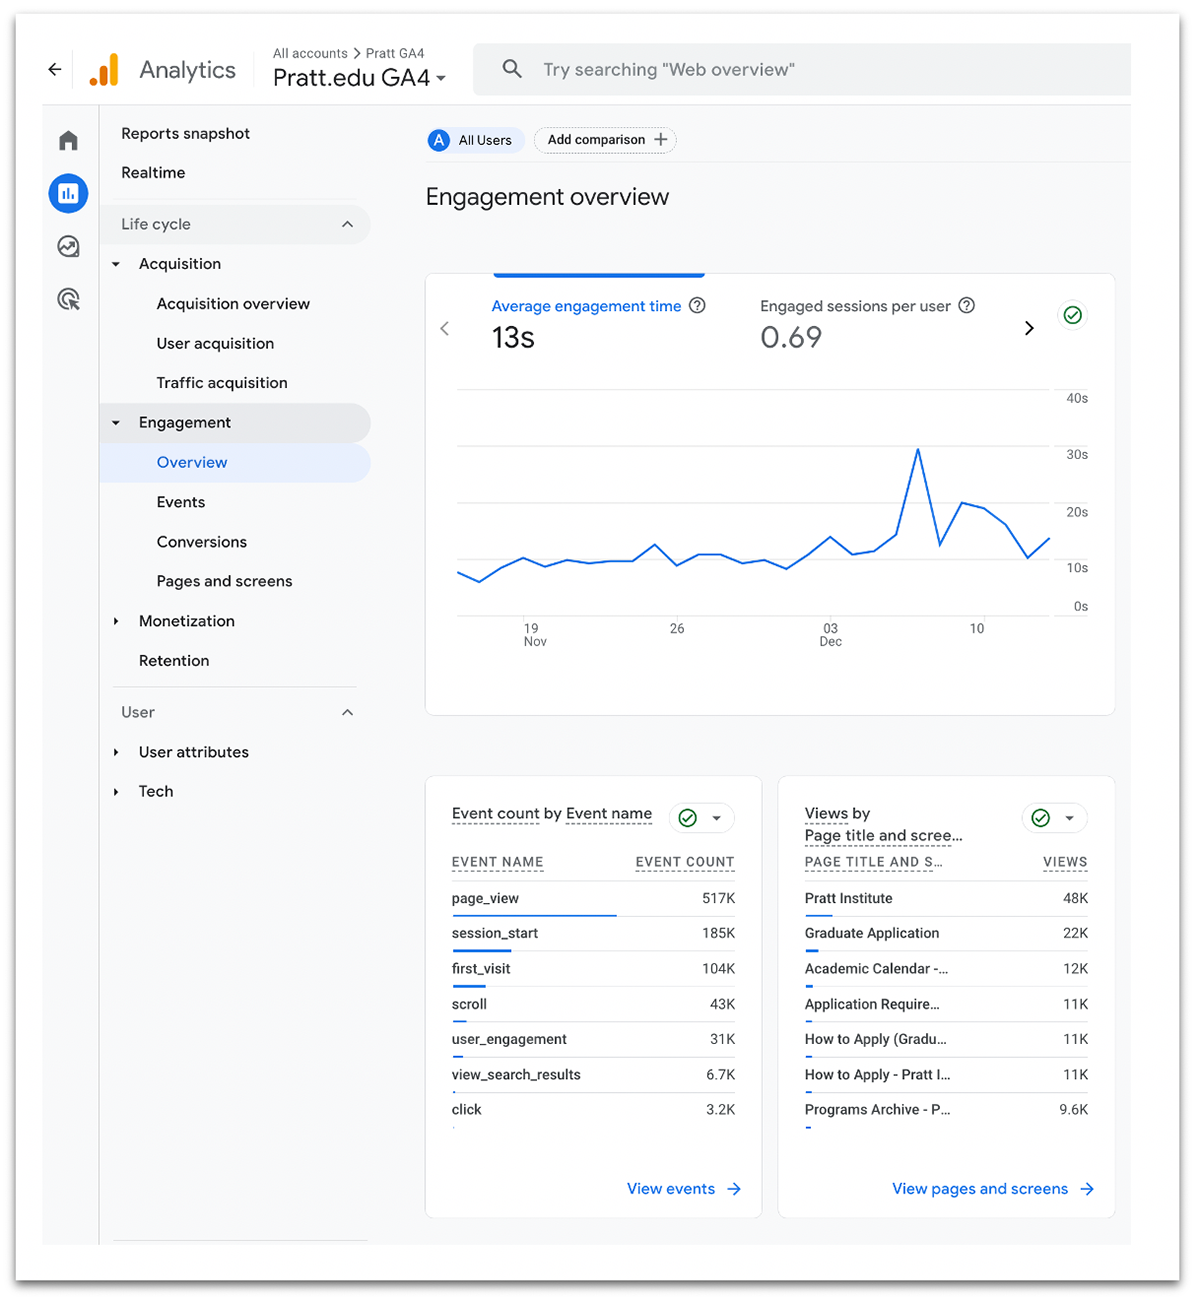
A Partial screenshot of Pratt Institute's Google Analytics 4

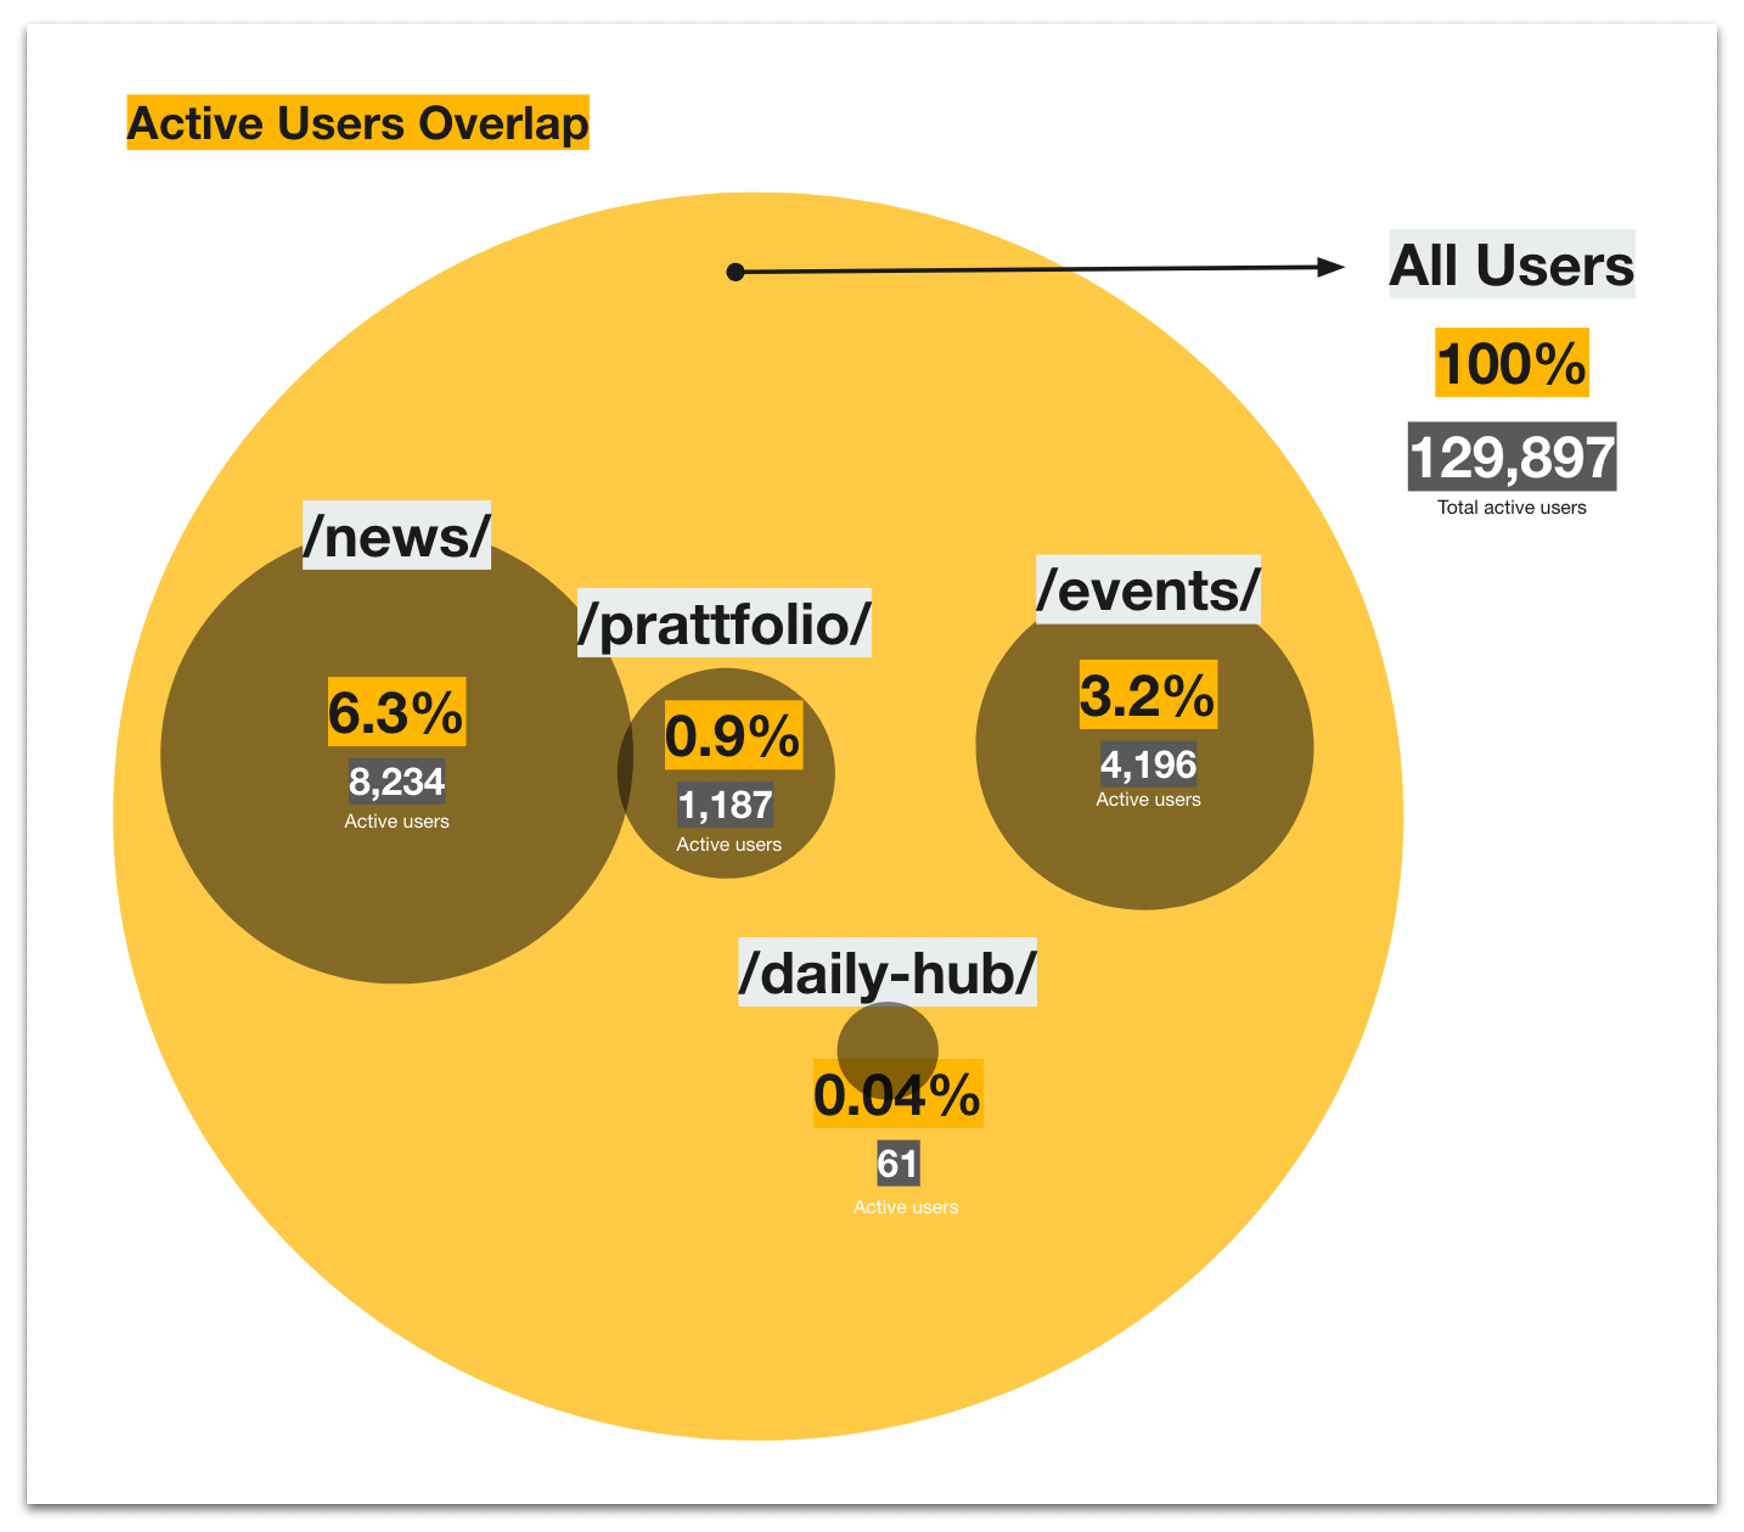
Out of the 129,897 active users who visited Pratt home pages within a 30-day period, 6.3% accessed /news/, 3.2% accessed /events/, 0.9% accessed /prattfolio/, and 0.04% accessed the /daily hub/.
Our goal is to improve the synergy among these user groups, creating a smoother navigation experience that motivates users to explore Pratt's diverse pages. In the following sections, we will look into the observation results of each four sections, and provide actionable recommendations.

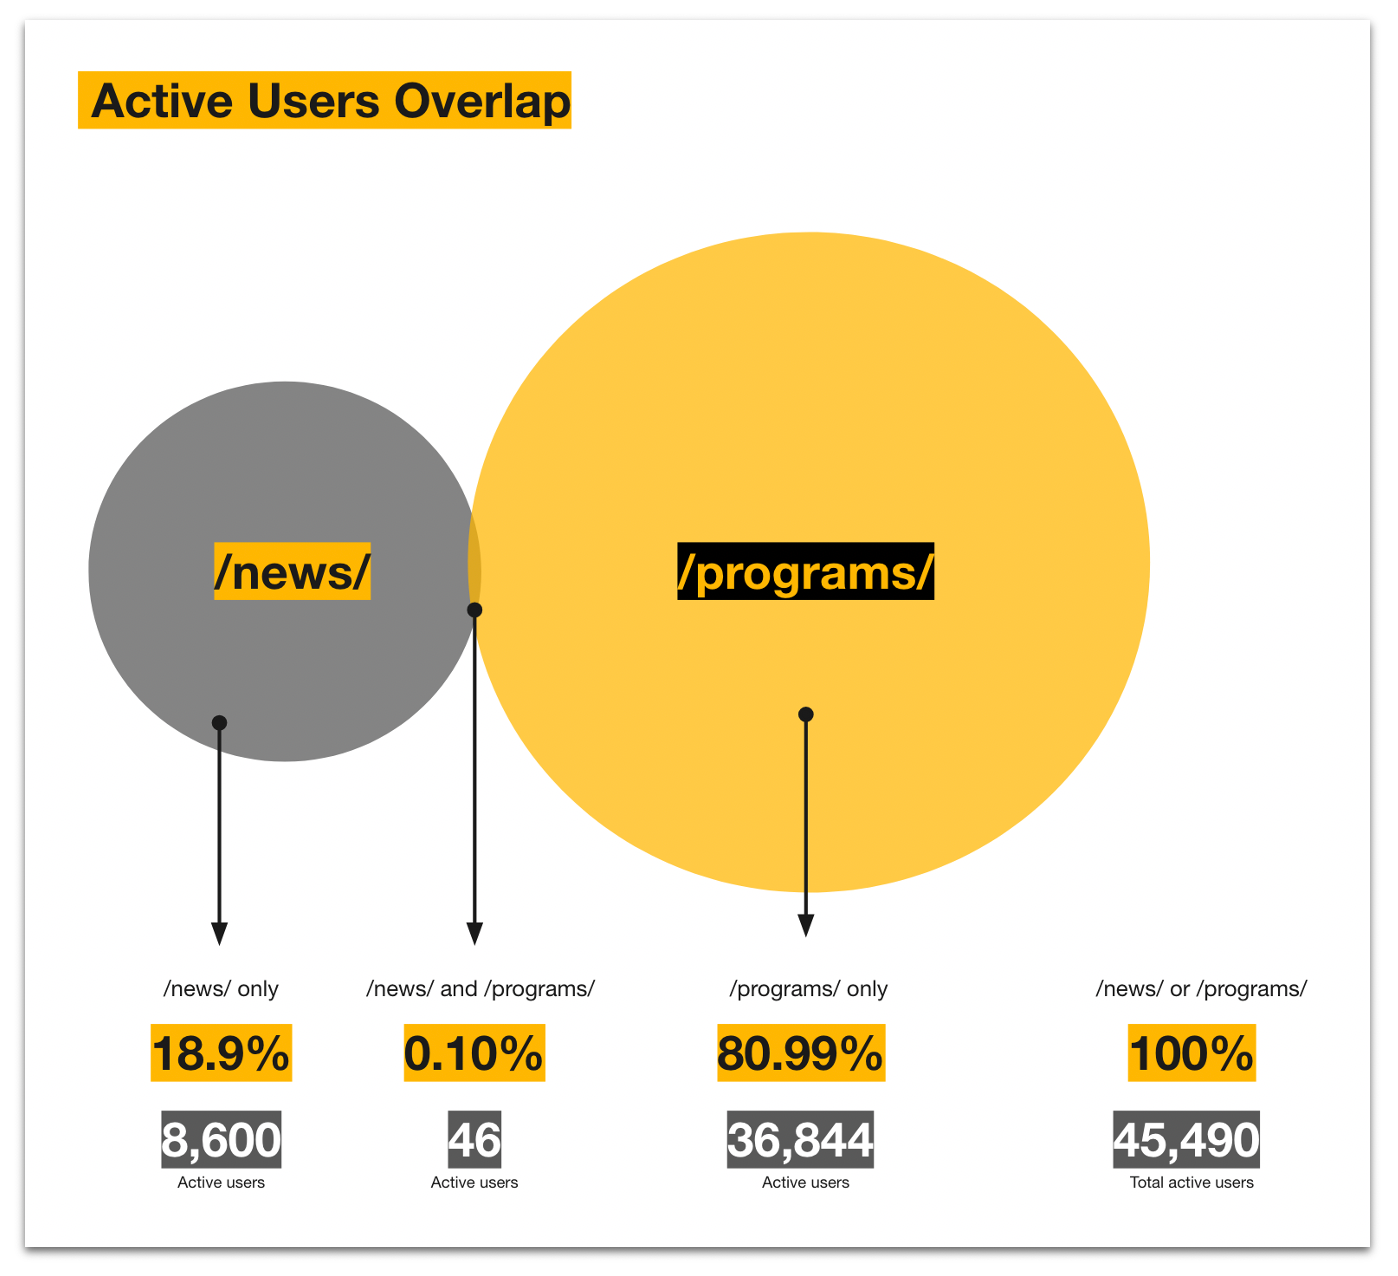
1. The news sections are not driving substantial traffic to the program pages.
As of October 2023, among active users who accessed both news pages and program pages, only 0.10% demonstrated engagement with both. While news pages attract the highest number of active users among the four sections—news, events, daily-hub, and Prattfolio—the traffic leading to program pages is significantly small.
Our primary objective is to pinpoint strategies that can notably enhance this overlap, fostering a seamless navigation experience. This approach aims to encourage users to explore news content and ultimately cultivate a heightened interest in exploring and applying to various programs offered.
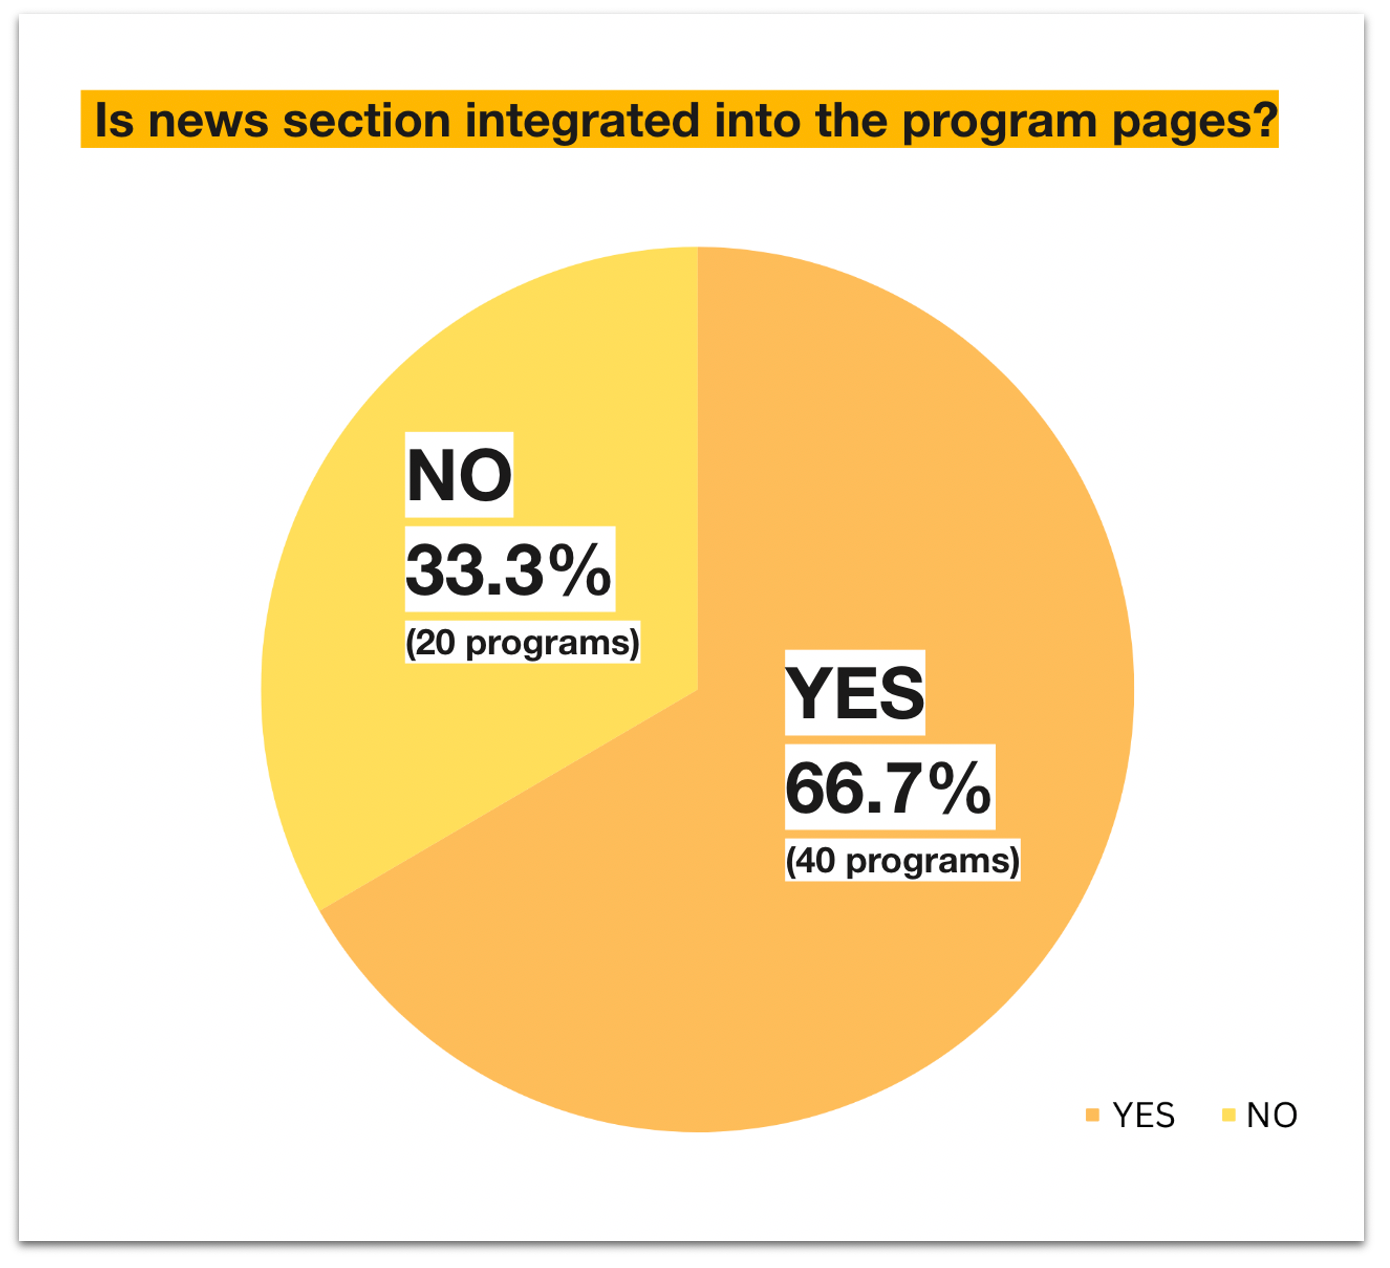
2. Some programs miss out having their own embedded news sections.
Some programs miss out on having their own news sections. Out of the 60 program pages, 40 include sections that link to Pratt News.
These sections are labeled with various names such as Success Stories, Our Stories, News, Events, etc. This suggests that news sections are not uniformly integrated across all programs, and their varied titles make it challenging to extract and analyze data comprehensively through GA4 for further insights.
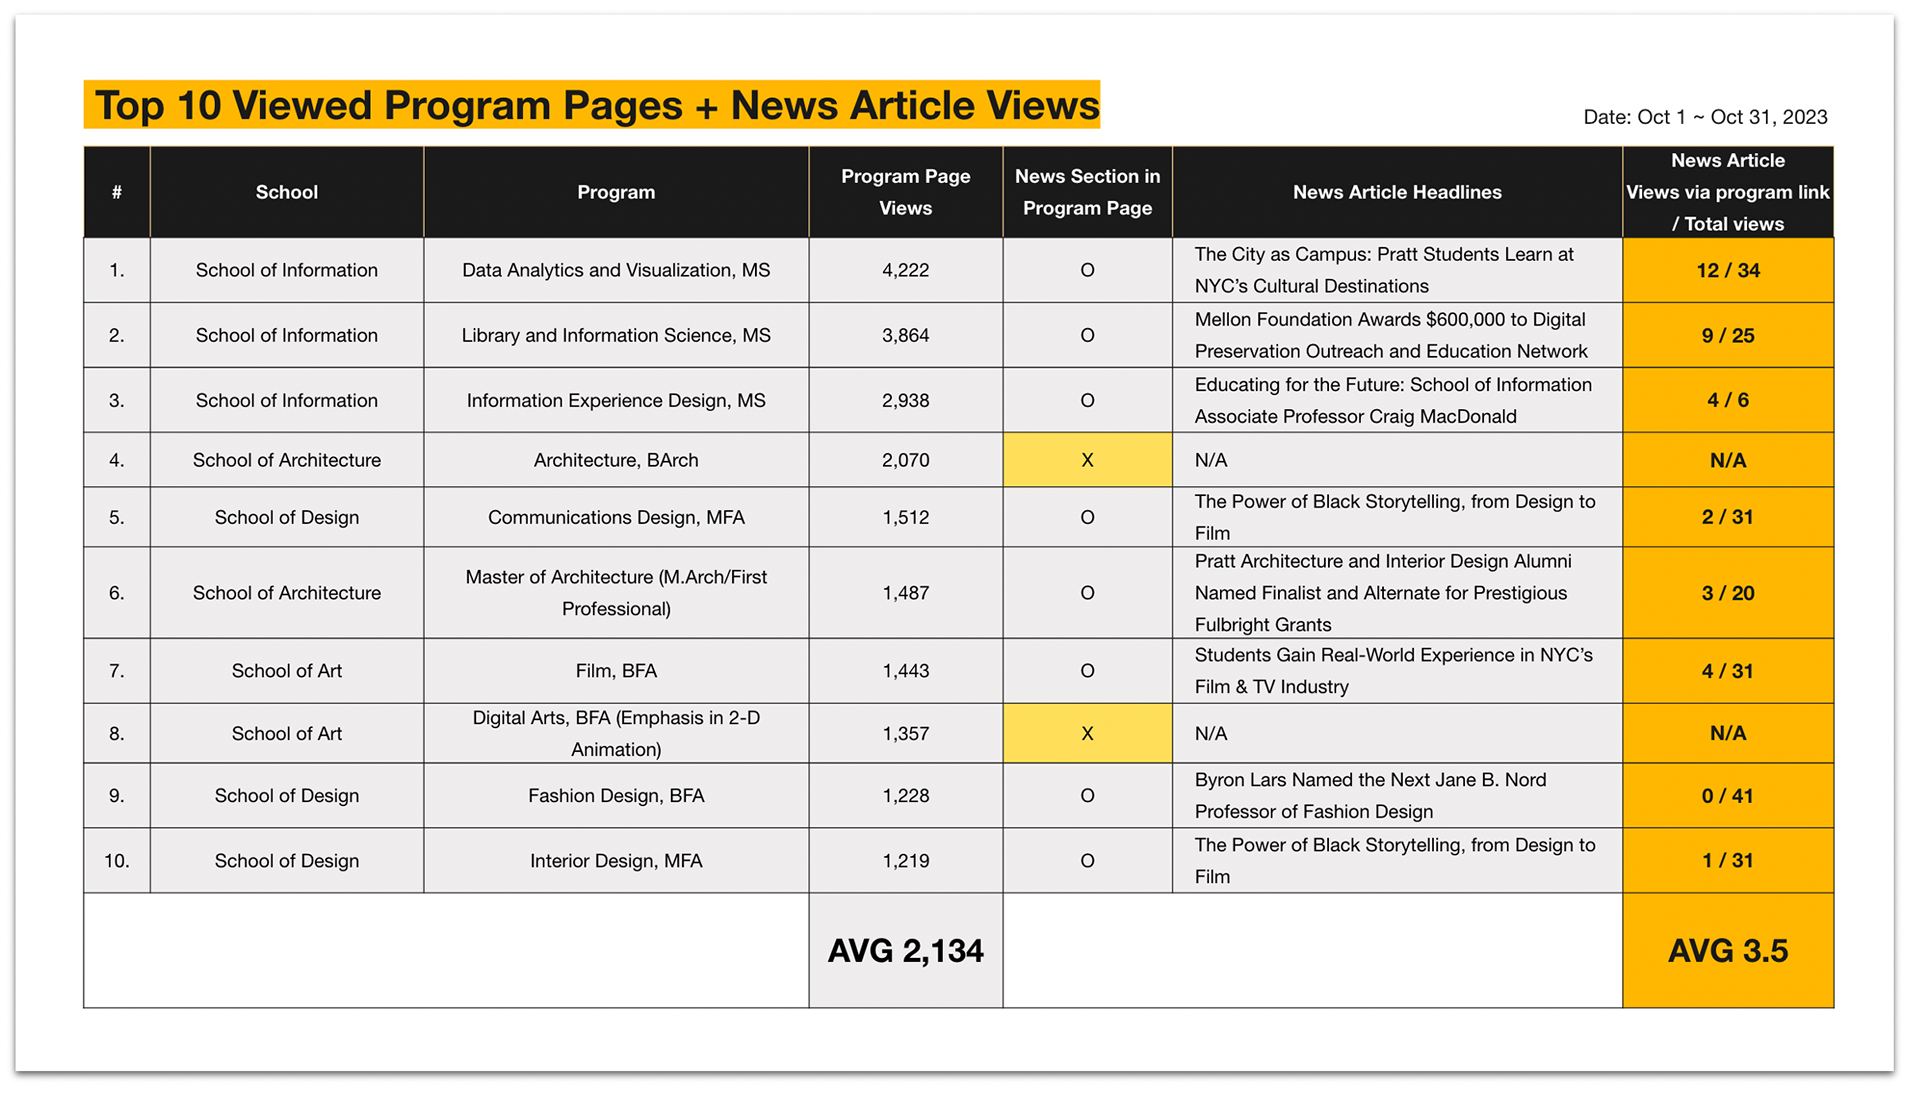
3. The embedded news sections are receiving low views.
Despite high program page visits, only 0.16% engage with integrated news articles. Within the top 10 most viewed program pages, an average of 3.5 views, representing only 0.16% of the total average of 2,134 program page views, are directed towards the linked news articles integrated into the program pages (Figure below). This suggests that, despite a substantial number of users accessing program pages, the integrated news section does not effectively serve as compelling content to engage with.
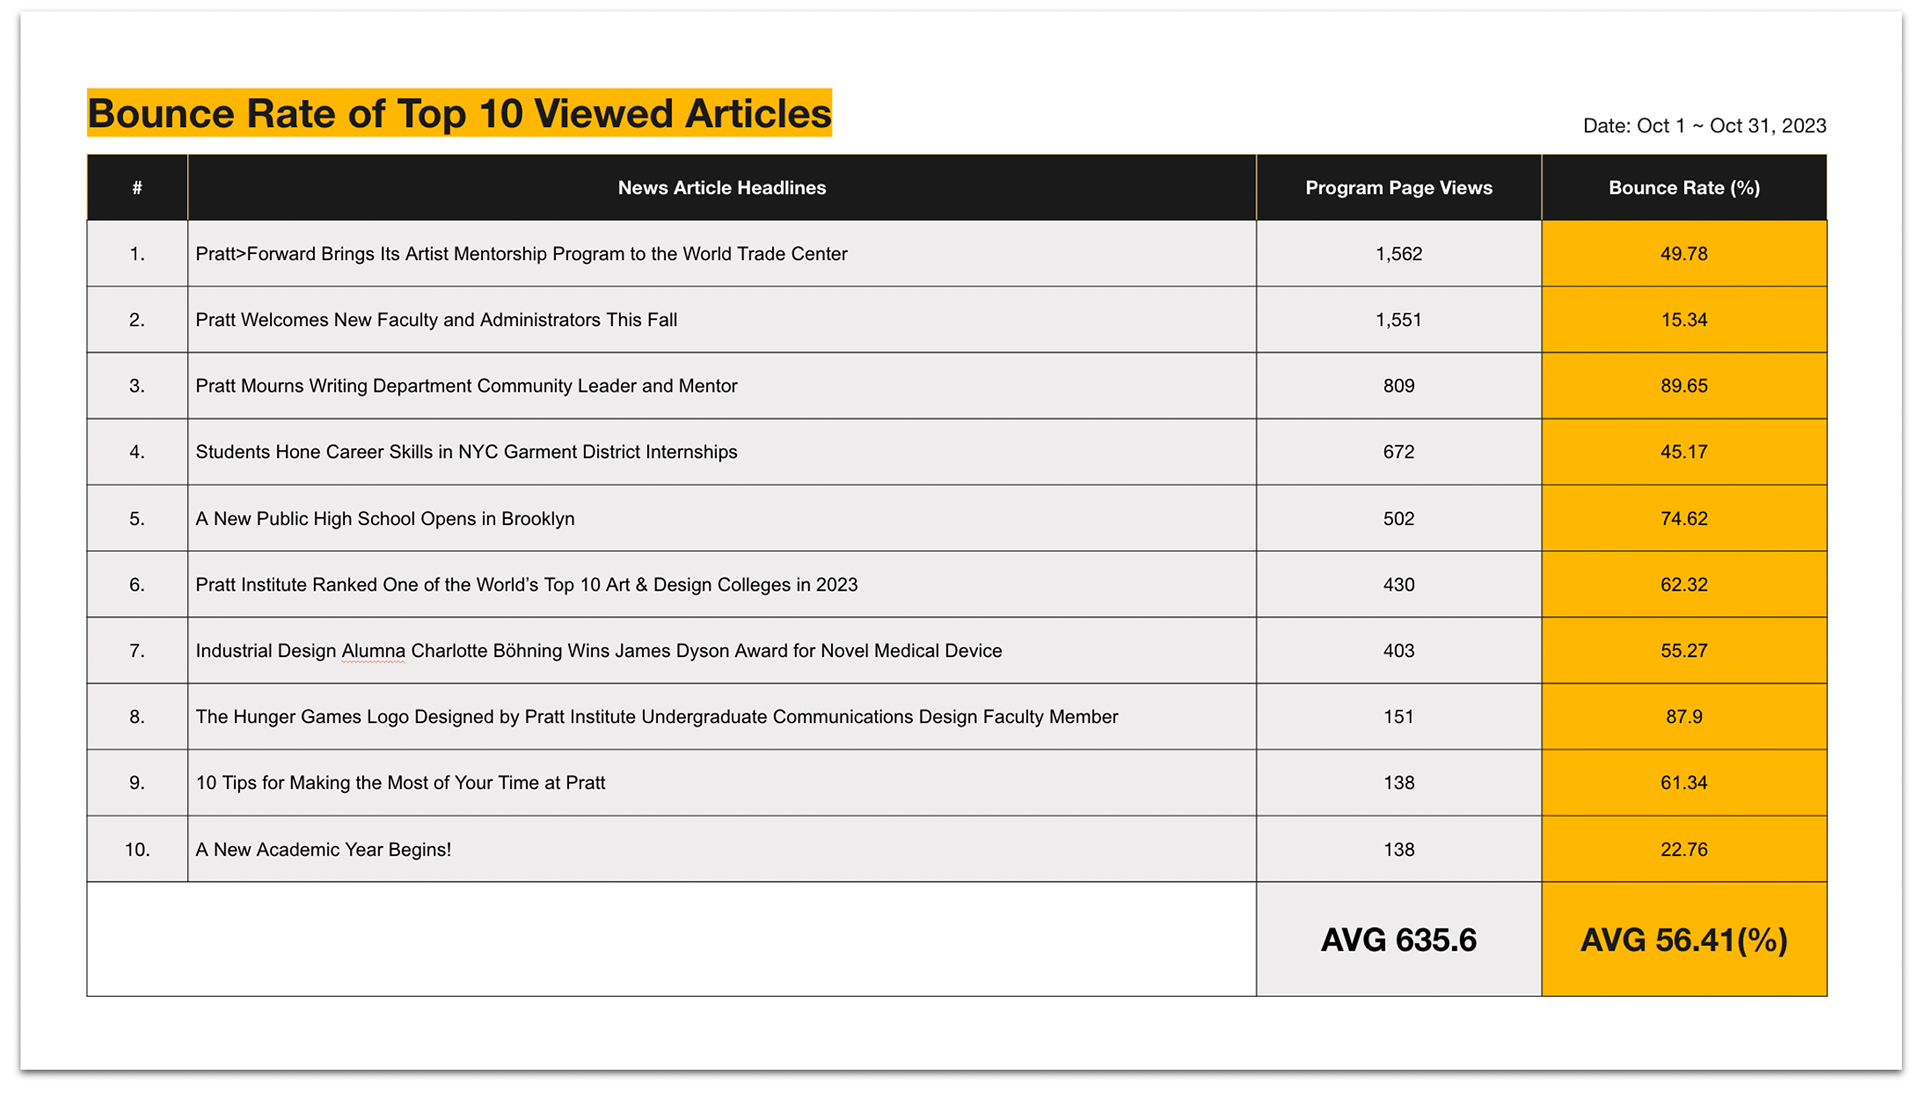
4. Featured news are receiving high views but grappling with a high bounce rate.
In contrast to embedded news articles, featured news articles attract considerable attention due to Pratt Institute's distinctive landing page, posting headlines prominently at the page's summit. Other institutions such as Parsons School of Design or School of Visual Arts, commence with general school information at the summit of the landing page. Top 10 viewed articles are averaging 635.6 views, however contend with a substantial average bounce rate of 56.41%, a figure surpassing the typical moderate bounce rate of less than 40% (Figure below).
Note that top 10 articles include featured and non-featured articles, since due to GA4 limitations it is impossible to distinguish both. It shows the tendency that featured articles lead a lot of traffic to the article page compared to those embedded into the program pages.

1. For Embedded News Sections:
Unify the label of news sections across programs and set up a custom event in GA4 for clearer user engagement insights.
Unify the label of news sections across programs and set up a custom event in GA4 for clearer user engagement insights.
To improve data analysis, it's recommended to make news sections consistent across all program pages. Right now various names are making it hard to gather and analyze data through GA4. To better track user entry into the news section from different program pages, consider setting up a unified "custom event" in GA4. This will give us a clearer picture of how users are engaging with embedded news content, helping us make more informed decisions.
2. For Featured News Sections:
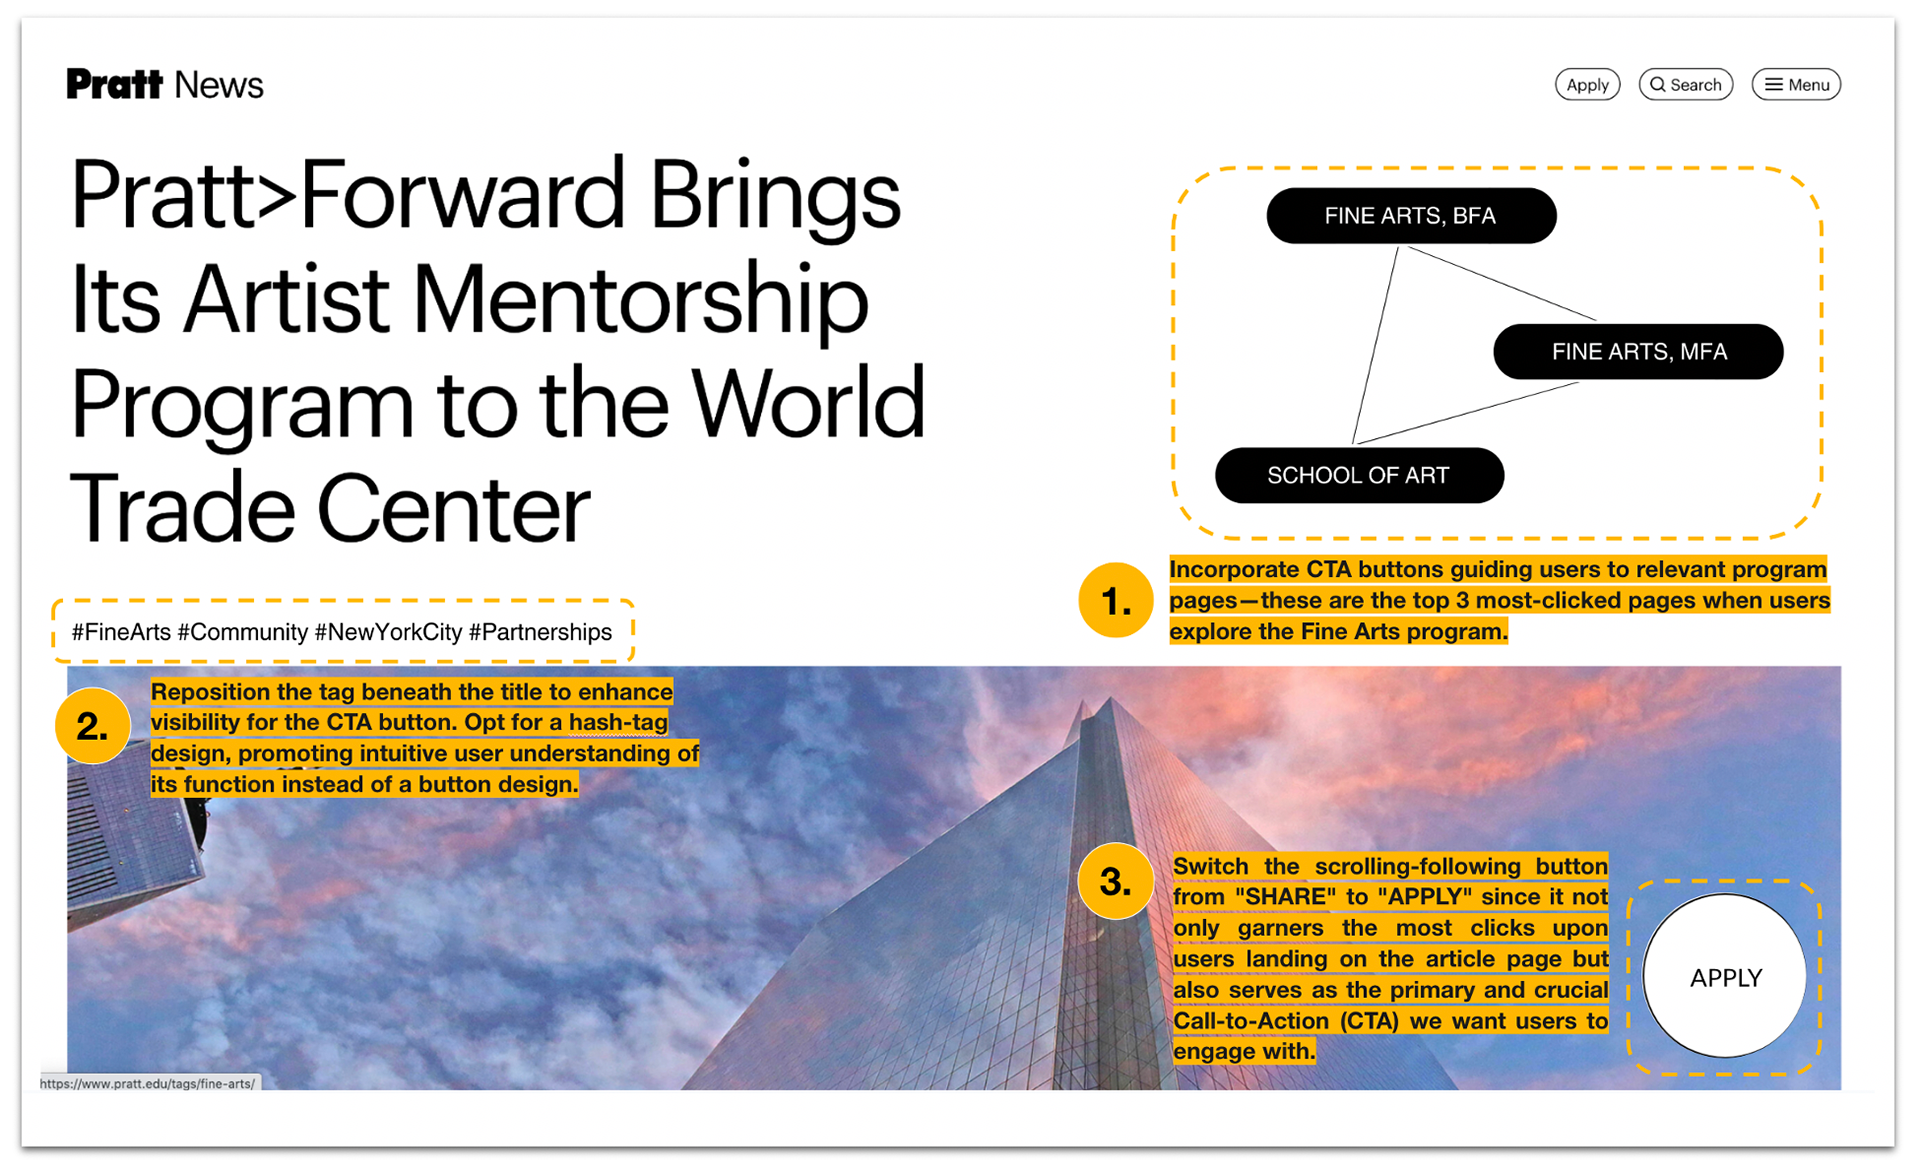
Add intuitive call-to-action buttons to program-related news that is receiving high amount of attention.
Add intuitive call-to-action buttons to program-related news that is receiving high amount of attention.
Take, for example, the most-viewed article in October 2023, "Pratt>Forward Brings Its Artist Mentorship Program to the World Trade Center" (Figure I, in next page). First, instead of the tag on the right corner, Incorporate CTA buttons guiding users to relevant program pages—these are the top 3 most-clicked pages when users explore the Fine Arts program. Second, reposition the tag beneath the title to enhance visibility for the CTA button. Opt for a hash-tag design, promoting intuitive user understanding of its function instead of a button design. Third, switch the scrolling-following button from "SHARE" to "APPLY" since it not only garners the most clicks upon users landing on the article page but also serves as the primary and crucial Call-to-Action (CTA) we want users to engage with.
3. For All Sections: Increase internal links.
More links within pages will allow users to hop to different sections, as well as gain more context for the sections they are in. Especially within the four sections that were analyzed, having additional internal links to different parts of the site will increase the time spent on the site, and give users more information that could intrigue them further.
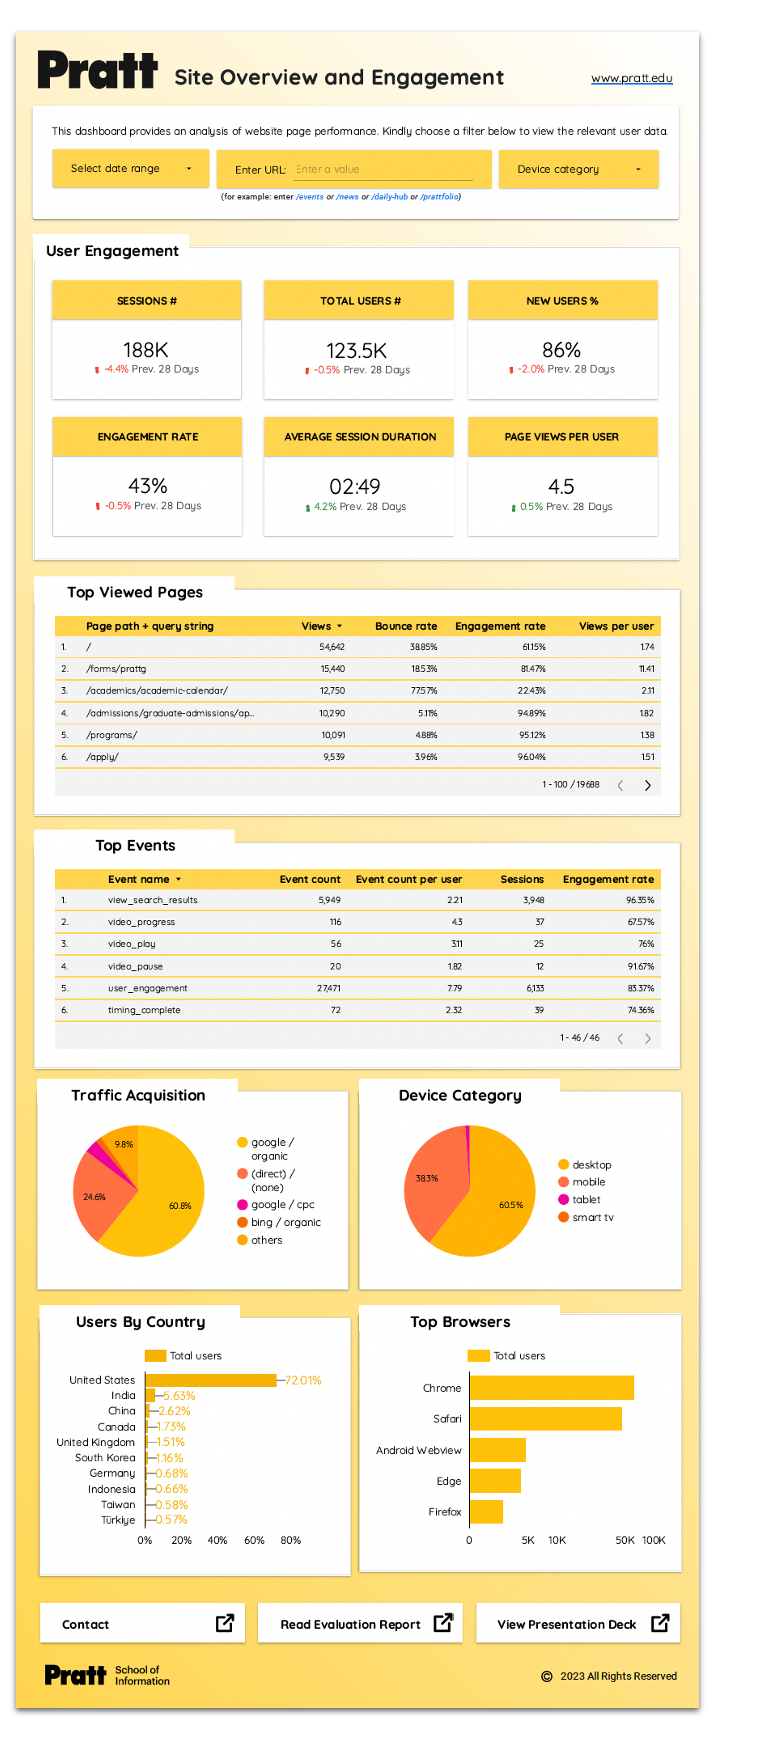
As part of our deliverables, we developed a Google Looker Studio Dashboard for our clients. This dashboard automatically updates data, enabling clients to access crucial numbers and metrics without the need to navigate Google Analytics 4 themselves.
The dashboard was meticulously designed to offer users the ability to navigate through various functions:
1. Filters: Clients have the flexibility to customize data views using filters such as (1) Date Range, (2) Specific Page URL, and (3) Device Category. This empowers our clients to precisely pinpoint data relevant to the specific user segments they are targeting.
2. Top Viewed Pages and Top Events: Clients can easily observe the top user engagement activities, highlighted by metrics such as Views, Bounce Rate, Engagement Rate, and more.
3. Traffic Acquisition / Device Category / User by Country / Top Browsers: These four distinct segments were customized to meet our client's specific tracking needs, offering a detailed view of user data.
◀ Screenshot of Pratt Institute's Looker Studio Dashboard

My team and I delivered our report and slide deck to the client, and they expressed great satisfaction with our work. Their primary concern revolved around determining the impact of news and events on website traffic, and they were particularly keen on incorporating custom events for enhanced goal tracking within Google Analytics.
For me, exploring the integration of Google Analytics into a website for providing quantitative feedback on visitors' experiences proved to be intriguing. This project significantly improved my understanding of how web analytics metrics and key performance indicators align with an organization's objectives. Recognizing the value of tracking overall website performance by examining user origins, page visits, and interaction patterns was particularly enlightening.
Going Forward...
If I were to continue this project, I would do advanced usability testing such as A/B testing to see what attracts more users, and also do supplementary analysis such as SEO audit to see the overall optimization. Additionally, I would seek to observe how the implementation of custom event tracking could offer more profound insights into specific areas of user interaction with the website.
Interested in learning more?
Please feel free to email me at lseo3@pratt.edu if you would like to chat about my work.